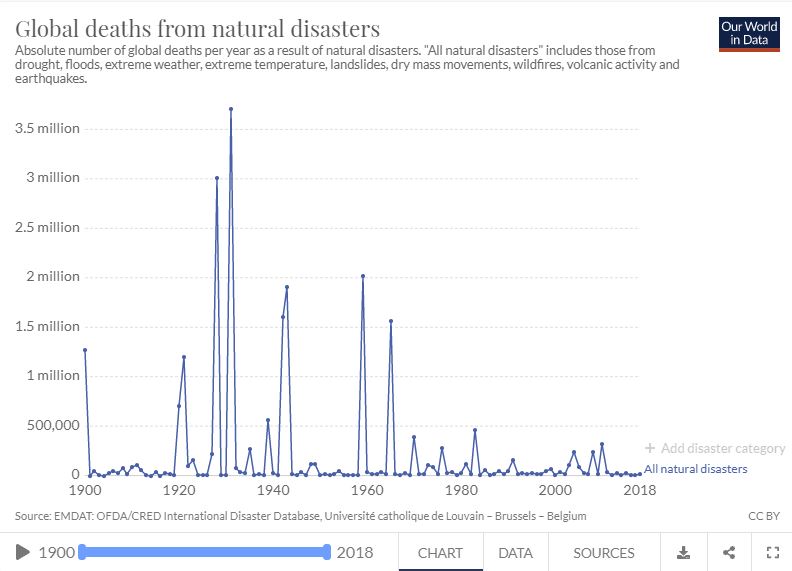
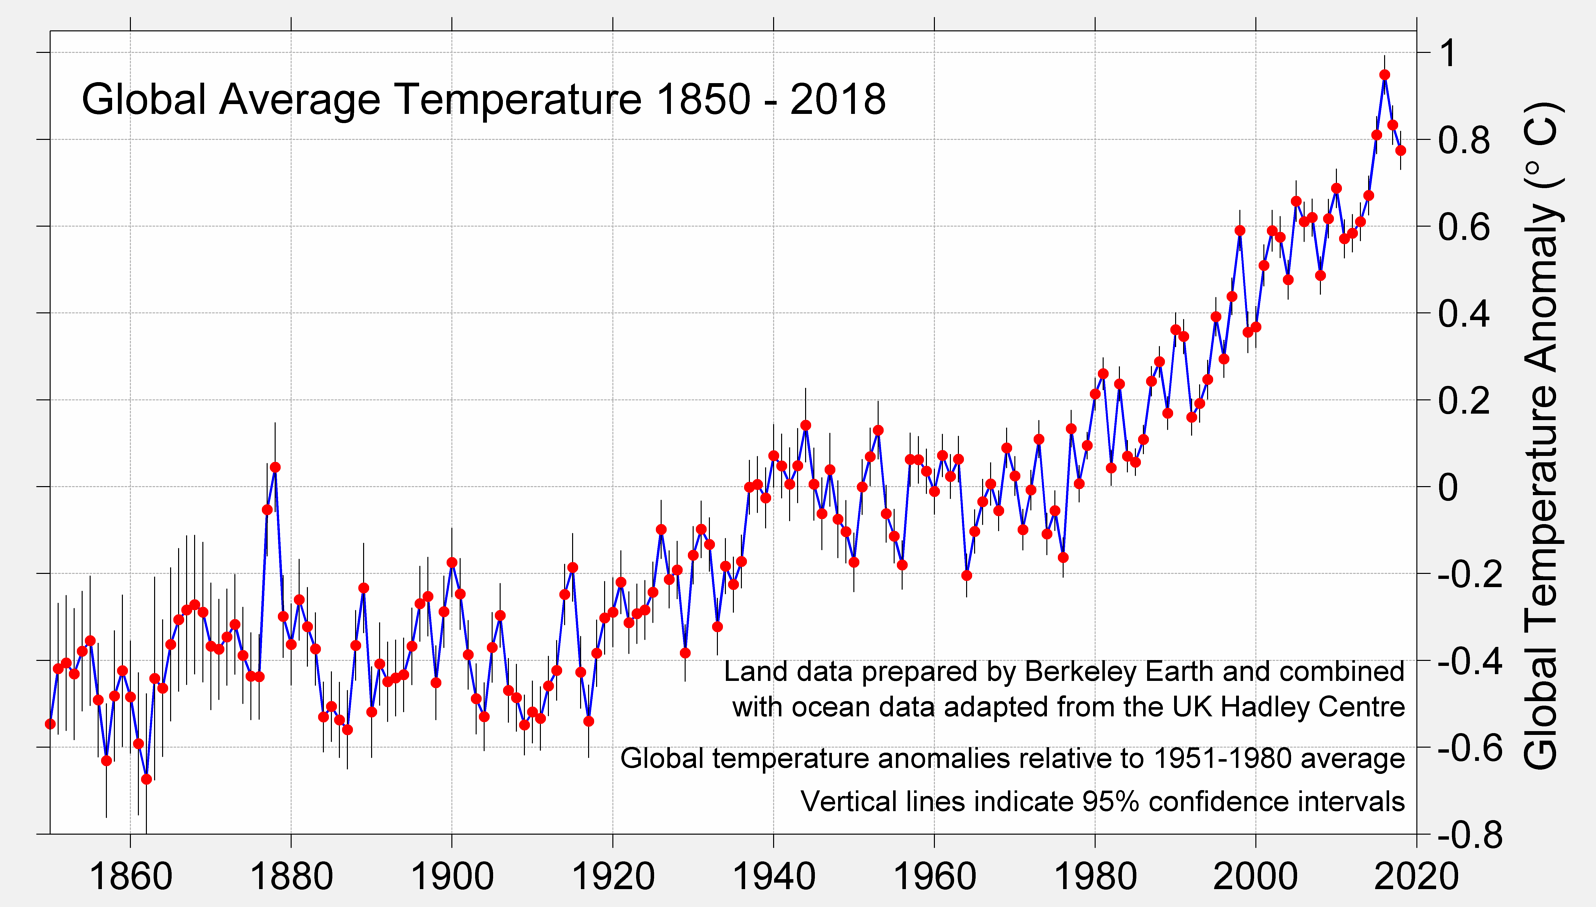
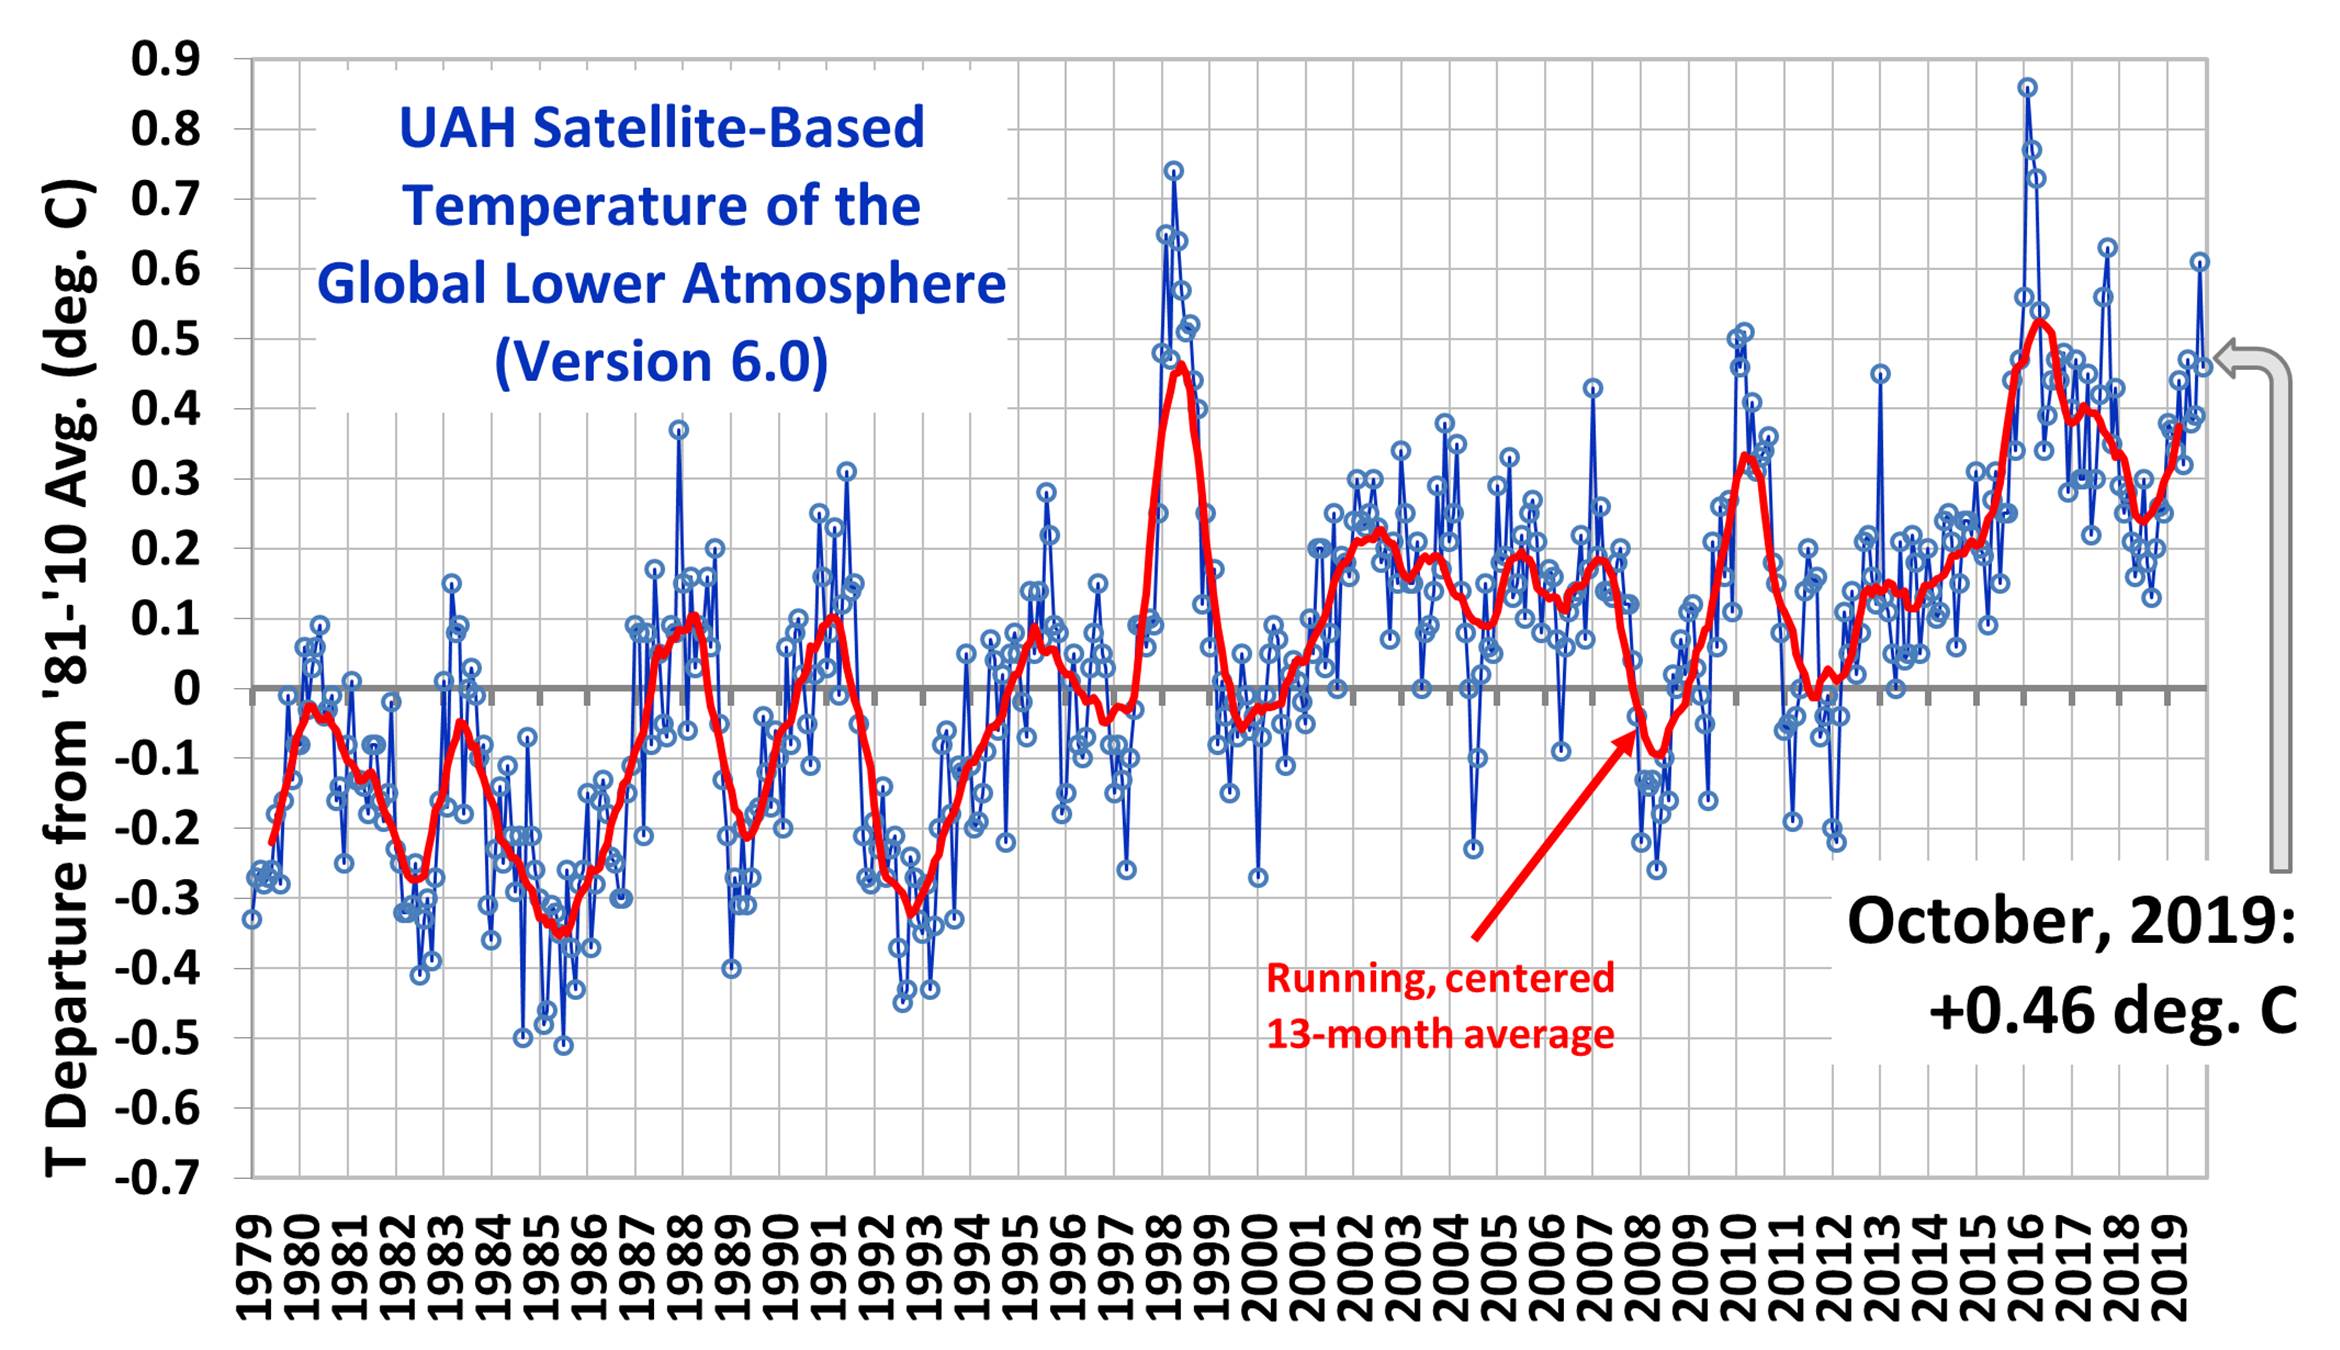
Cyclones are not the only form of extreme weather Lee. Prevalence of floods, heatwaves, heavier rainstorms, droughts and fires have all increased markedly - and here's some actual science that demonstrates that.
National Climate Assessment
The National Climate Assessment summarizes the impacts of climate change on the United States, now and in the future.
New data confirm increased frequency of extreme weather events: European national science academies urge further action on climate change adaptation
New data show that extreme weather events have become more frequent over the past 36 years, with a significant uptick in floods and other hydrological events compared even with five years ago, according to a new publication.
www.sciencedaily.com